The Republican “Unified Framework” tax reform would eliminate the federal income tax deduction for state and local taxes (SALT), available to itemizers. What is the SALT deduction? Simply put, it allows taxpayers to avoid being taxed by the federal government on income used to pay taxes to the states and localities. Among other things, proponents of the reform argue that the deduction is an incentive for state and local governments to raise taxes, and that it subsidizes high-tax states to the detriment of low-tax states. Opponents argue, however, that the deduction encourages spending on public goods that benefit society and prevents double taxation. Clearly, there are important arguments on both sides of the issue.[1]
Now that the SALT deduction is on the table, it is pertinent to ask who wins and who loses under the proposed tax plan. To help answer this question, the Rockefeller Institute recently released a report featuring a broader analysis of the federal budget, examining payments to the federal government from states’ residents and economies, and the distribution of federal spending by state. The difference between payments to the federal government from a state and federal spending in the state is often called a “balance of payments.”
Under the existing tax structure, some states pay far more to the federal government than they receive, and some receive far more than they pay in. This is not surprising because one goal of the federal system is redistribution. Richer states tend to pay more taxes, per person, to the federal government and poorer states tend to receive larger payments, per person, particularly for social programs. Many other items are distributed nonuniformly as well. For example, rural states with long driving distances tend to get larger per-capita distributions of federal gas tax funds, and states with older populations tend to get larger payments, per capita, for Medicare and Social Security.
Who Are the “Winners” and “Losers”
Still, it is important for policymakers to understand how this all nets out — which states get the most in aggregate, and which the least. It is instructive to compare the results of this broader budget analysis to the subsidy from low-tax states to high-tax states embodied in the SALT deduction.
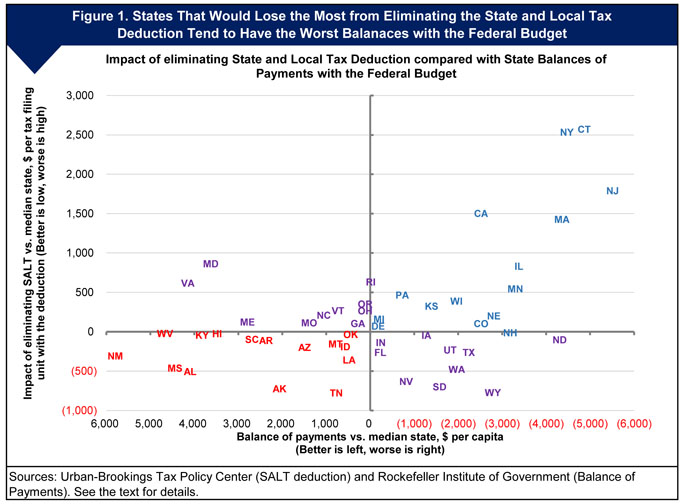
Figure 1 does exactly this. The vertical axis measures how much federal income tax would go up in each state, per tax filer with the deduction, if the deduction for state and local taxes were eliminated. Each state is compared to the median state, so taxpayers in states that are above the horizontal line at zero would see their federal income taxes go up by more than the typical state, while those below would see their taxes go up by less than the typical state.[3] The horizontal axis measures each state’s balance of payments with the federal government, per capita, in comparison to the median state, with the data arrayed from worst on the right to best on the left. States to the left of the vertical line at zero have a better balance of payments than the median state, and those to the right are worse off.
States in the upper right quadrant pay more into the federal budget than the typical state, and would pay disproportionately more in taxes if the SALT deduction were eliminated. As indicated by Figure 1, the proposed tax plan will have a disproportionate impact on blue states such as New York and California, which generally tend to have higher state and local taxes. Not surprisingly, some blue-state GOP legislators have already spoken out against repeal. By comparison, states in the lower-left quadrant pay less into the federal budget than the typical state, and would pay disproportionately less in taxes if the deduction were eliminated.
What is clear from the figure below is that many of the states that would be hurt most by repeal also currently pay the most into the federal fisc. Some states, like Wyoming, have a negative balance of payments with the federal government, and elimination of SALT is an overall increase in their taxes. However, in those cases the increase is less than the median tax increase. In other negative balance states, like Connecticut, the impact of losing the SALT deduction is much greater, with tax increases far exceeding the median.
In essence, the net result is the states that give more face greater tax increases/impact with the elimination of the SALT deduction, while the states that get more get another tax break/benefit from the elimination of the SALT deduction.
Data from Table A1 of Sammartino and Rueben, Revisiting the State and Local Tax Deduction.
Federal tax reform is likely to be a package of changes, rather than a single proposal. Ultimately, some of these changes are likely to help states that would be disadvantaged by elimination of the SALT deduction. While the net impact of a full federal tax reform package on individual states could be different than the impact of the deduction viewed in isolation, the SALT deduction could still play a major role in determining the distributional consequences of a full tax reform package, not to mention its overall success.
Policymakers may have differing opinions on the merits of the SALT deduction, and on the extent to which the federal budget should redistribute funds but, as our analysis suggests, they should be aware of how the deduction fits in the context of the full federal budget.
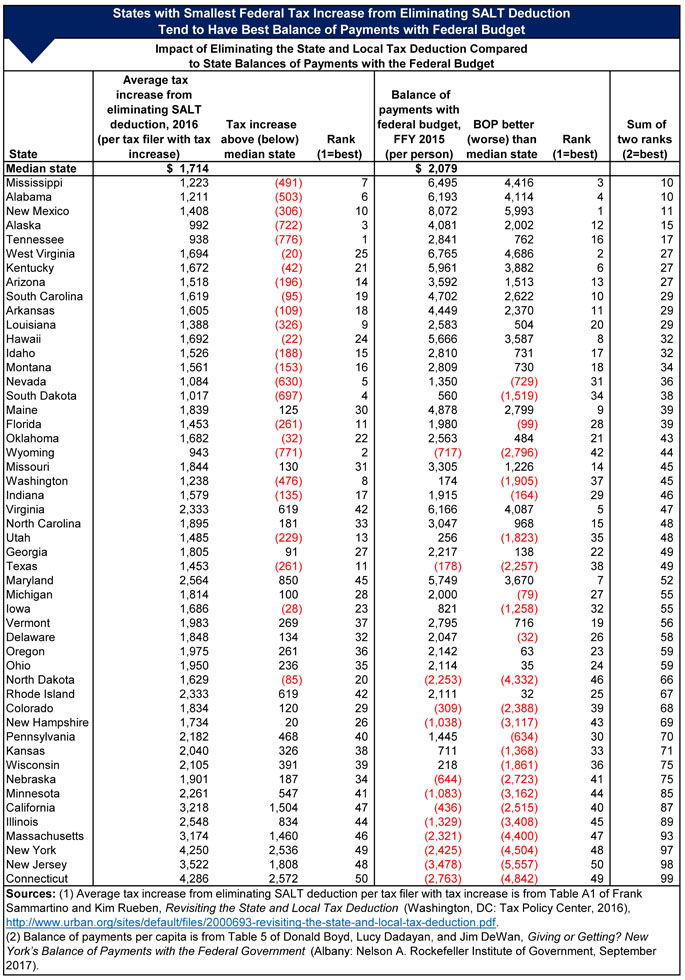
Table 1 provides the state-by-state data behind the graph: