This is part of a multi-part series examining school district regionalization in New York State. Read the full series below:
Some of New York State’s smallest school districts are pulling together to build stronger educational opportunities for students. And a new, interactive, artificial intelligence-powered database is helping them do just that.
Public school districts across New York State have been grappling with the effects of declining student enrollment for years. From school years 2013-14 to 2023-24, New York lost more than 300,000 students, with total K-12 enrollment dropping from approximately 2,560,000 to around 2,237,000, a decrease of 12.6 percent (see Figure 1).
Source: Rockefeller Institute analysis of data from the New York State Education Department’s Enrollment Data Archive, https://www.p12.nysed.gov/irs/statistics/enroll-n-staff/ArchiveEnrollmentData.html.
The state’s largest school districts—the “Big 5” of New York City, Buffalo, Rochester, Syracuse, and Yonkers—followed the statewide pattern of annual decreases but also were disproportionately impacted by drops during the years of the COVID-19 pandemic, and saw a greater than average 10-year decrease in total enrollment of 17.3 percent, a drop of nearly 184,000 students (Figure 2).
Source: Rockefeller Institute analysis of data from the New York State Education Department’s Enrollment Data Archive, https://www.p12.nysed.gov/irs/statistics/enroll-n-staff/ArchiveEnrollmentData.html.
Outside of the Big 5, the trend of declining public school enrollment is particularly concerning for the state’s smaller districts. Figure 3 reveals that over the past decade, the smaller the size of the school district, the greater the percentage enrollment loss has been. Grouping the state’s school districts by size, the bottom four deciles—that is, the state’s smallest 40 percent of school districts1—each saw percentage losses in total K-12 enrollment greater than the statewide average.
Source: Rockefeller Institute analysis of data from the New York State Education Department’s Enrollment Data Archive, https://www.p12.nysed.gov/irs/statistics/enroll-n-staff/ArchiveEnrollmentData.html..
During this same period, 34 districts dropped below 1,000 students by 2023-24 after starting with at least that many enrolled in 2013-14; only one district moved in the opposite direction (Elmsford Union Free School District in Westchester County grew from 974 to 1,016 students).2 An earlier article by the Rockefeller Institute in this series on the need for regional collaboration among small school districts noted that there are 280 districts in New York that each enroll fewer than 1,000 students. As stated, “approximately 42 percent of the state’s school districts serve just 6 percent of its K-12 student population.” Most of these districts are in rural areas, with large, sparsely populated areas that pose unique challenges for providing and maintaining robust educational experiences for all students.
While the statewide share of students being served by these smaller districts didn’t change much—the proportion of students in the smallest six deciles dropped by about 1 percent while the proportion served by the top three deciles grew by about 1 percent3—the growth in the number of smaller districts and the recognition that these districts typically are serving fewer and fewer students each year is a reality that presents substantial challenges to educational, financial, and operational planning for school district leadership. With student enrollment driving numerous components of state funding calculations, small school districts’ budgets face intense pressure from declining enrollment. Declining public school enrollment often is the direct result of local population loss, which also causes a drop in the local property tax base, a source of revenue relied heavily upon by school districts. While revenue is declining, annual costs, including large-ticket items such as wages and employee benefits, transportation expenses, and building maintenance, are increasing, and districts are facing demands for expanded services, including student mental health programs and increasing services for students with special needs and English language learners. This “double-whammy” on the revenue side (lower property tax revenue and lower enrollment-based state aid), combined with annually rising costs and new demands for services, highlights the need for innovative ideas to effectively and efficiently meet students’ educational needs.
Smaller school districts have the same responsibilities to meet their students’ educational needs as do large districts, but are not always able to take advantage of economies of scale in the same way. While a large district enrolling 10,000 students may be able to hire a full-time specialist in data analysis, behavioral health, or education for students with disabilities, for example, a district with an enrollment of 500 students—5 percent of the large district’s enrollment—almost certainly cannot hire a full-time specialist at 5 percent of the cost. Smaller school districts could take advantage of economies of scale by embracing regionalized services, however; neighboring school districts often combine resources and effort to meet combined student, administrative, and operational needs.
To help support the particular needs of small school districts, the Wayne-Finger Lakes Board of Cooperative Educational Services (BOCES) has launched a new, comprehensive data-driven Regionalization Dashboard that provides one model to support schools’ efforts to meet these challenges and find creative and effective solutions. Developed in partnership with the Genesee Valley BOCES, the Regionalization Dashboard is an ambitious effort designed to foster collaboration among school districts, drive efficiencies, and expand academic opportunities for students throughout the region. Spearheading this effort is the BOCES’s Regional Information Center, known as EduTech. EduTech compiles information from the region’s 47 districts’ student management and other data systems and transforms it into standard formats and values to meet state data reporting requirements. The director of EduTech, Kelli Eckdahl, manager of data services, Rich Yeoman, Heather Schuessler, EduTech’s coordinator of instructional data, and their team continue to expand and refine the Dashboard, and to train school district leaders on how it can serve as a powerful resource for developing regional solutions to local school district challenges.
The Regionalization Dashboard is more than just a data display—it is a dynamic, artificial intelligence-driven tool tailored to the evolving needs of regional education leaders, specifically designed to help inform decisions surrounding service partnerships. Developed in-house, the platform consolidates operational, financial, and enrollment data into one interactive interface. It pulls all publicly available data from the New York State Education Department (https://data.nysed.gov) and is updated several times each year to reflect fresh information.
Fueled by Copilot, a generative AI assistant powered by large language models (LLMs), the dashboard is designed to understand natural language prompts and interpret complex datasets:
This integration transforms the dashboard from a static reporting tool into a dynamic, conversational analytics experience, empowering leaders to make faster, more informed decisions.
In 2024, the New York State Education Department (NYSED), in partnership with BOCES leadership across the state, spearheaded an effort to encourage local school districts to think about regional strategies to meet financial, operational, and academic challenges being posed largely by shrinking student enrollment. NYSED developed the Regionalization Planning Strengths and Needs Tool, which organized the school district reflection process into three main domains:
Key district data are then compiled according to each of these thematic categories:
The Regionalization Dashboard draws on this structure, and its design also reflects direct input from chief school officers in the Wayne-Finger Lakes and Genesee Valley BOCES regions, aligning these data with locally identified priorities for action.
What sets this dashboard apart is its artificial intelligence-powered features, which transform it from a static data repository into a robust planning tool. Users can customize views, pose specific queries, and model potential scenarios, empowering the region’s school leaders to query about specific issues and make more informed, strategic decisions for collaborative solutions to local challenges.
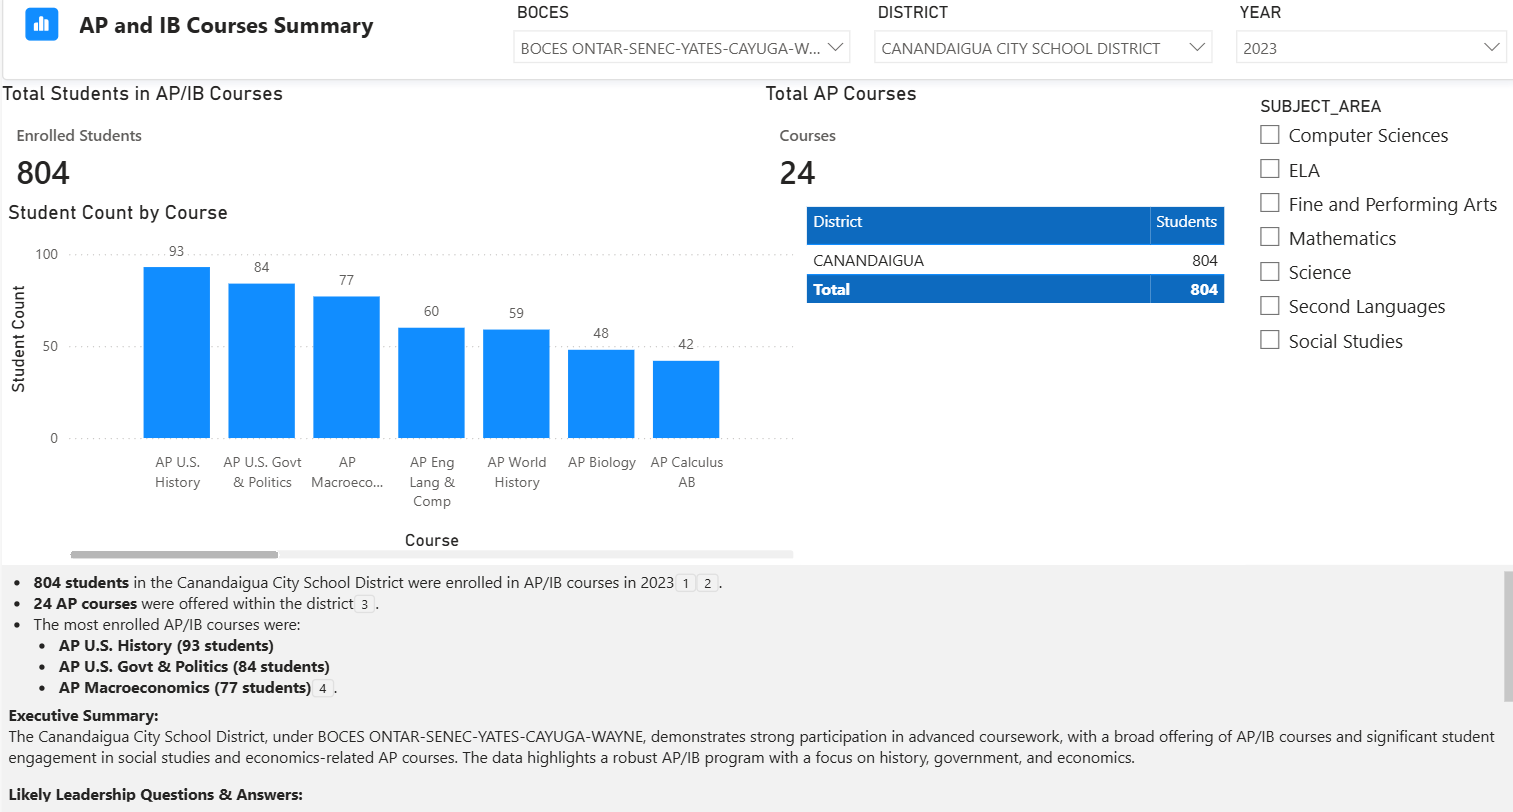
For example, a superintendent may be interested to see how their district’s offerings of Advanced Placement (AP) and International Baccalaureate (IB) courses compare to those of a neighboring district. The Dashboard allows the superintendent to navigate to an “AP/IB Course Summary” screen, set a filter for their respective BOCES and their own district and comparison districts, and select the desired year to examine:
The superintendent could also see which districts within the BOCES Region offer AP/IB courses in a specific content area:
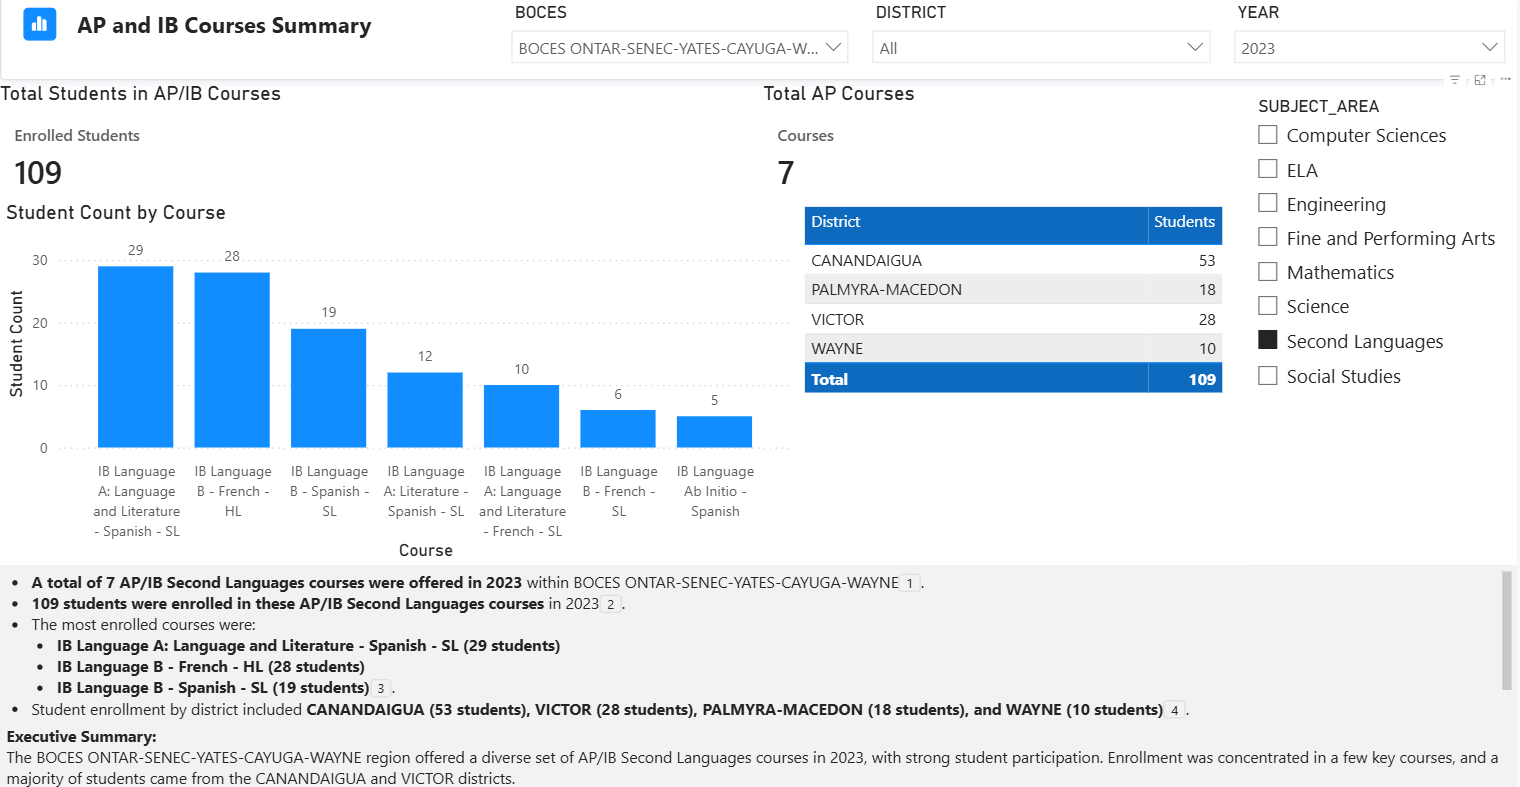
These reports can foster conversations among school districts on ways districts can collaborate to offer advanced coursework to students in areas of the region who may not have access to such offerings directly from their home district, and to avoid unnecessary duplication of effort when combining resources and offering a regionalized approach makes more sense.
As another example, a superintendent facing operational challenges due to declining student enrollment can use the Dashboard to easily select districts in the region with similar student needs to compare enrollment trends:
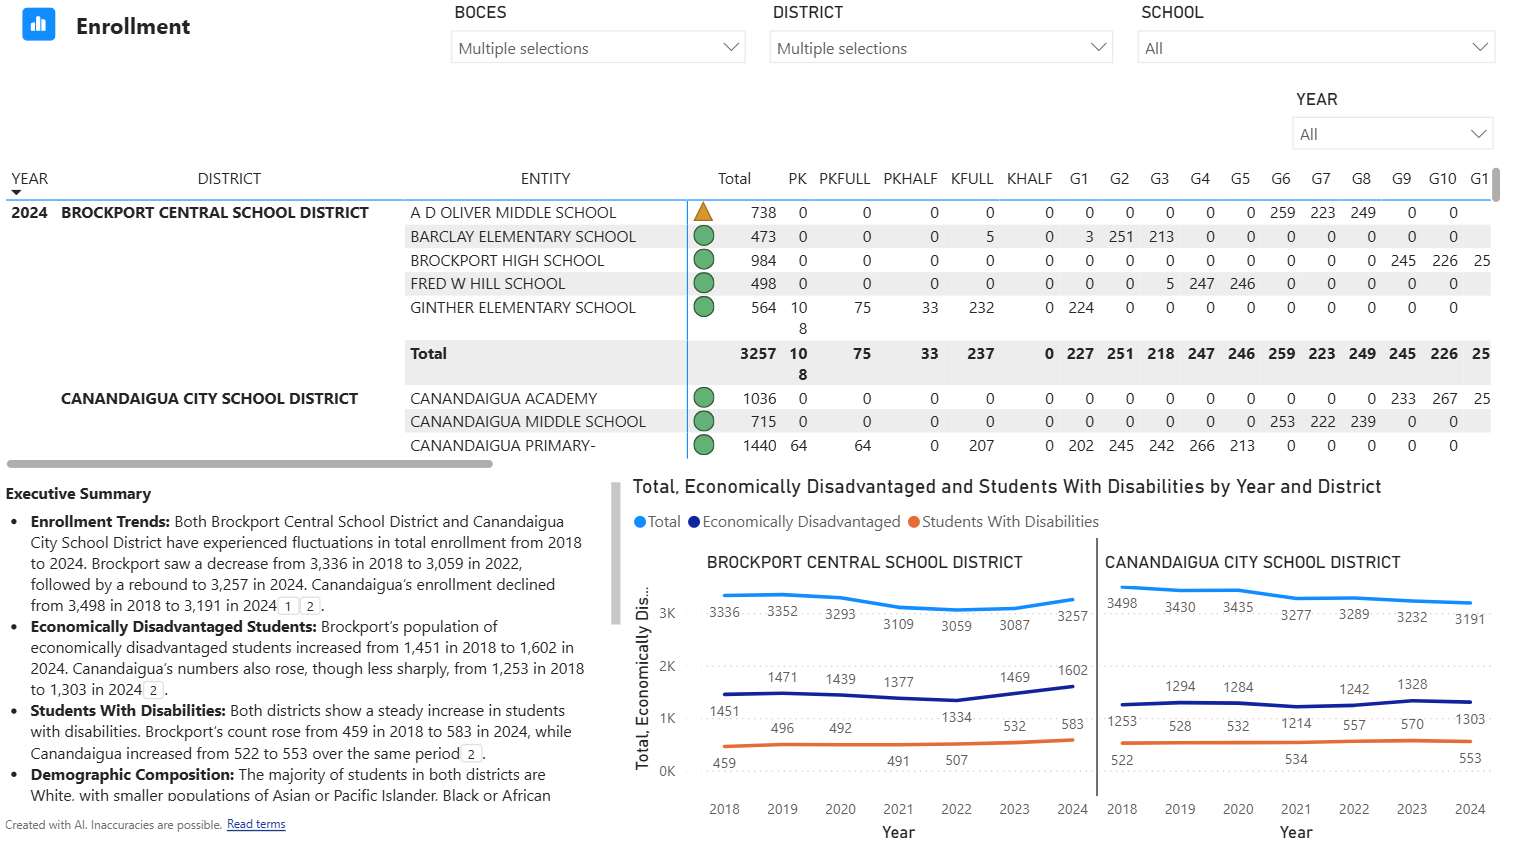
Using this information, district leaders can easily reach out to share best practices in meeting specific challenges, brainstorm to solve current problems, and strategize about how best to collaborate now to avoid more significant problems in the future.
At its core, the dashboard aims to support regional planning by organizing publicly available, up-to-date data into user-friendly visualizations. It equips educational leaders with the tools to explore issues collaboratively and respond proactively to shared challenges. The leadership at Wayne-Finger Lakes BOCES is training district leaders on how the Dashboard can best be used to support these efforts, focusing on particular areas identified by local district leaders. These include the following:
Transportation Needs.
Explore access and equity across rural and urban districts, identify regional transportation inefficiencies, and model shared services.
The Dashboard’s “Transportation Assessment” screen provides users with an overview of each district’s annual transportation expenditures, along with the average inflation. This information allows district leaders to note transportation cost trends for up to a ten-year period in their own and neighboring districts, potentially uncovering partner districts where collaboration and sharing resources could deliver efficiencies and cost savings.
Academic Needs.
Highlight gaps in program offerings and academic course use patterns, with a goal of ensuring equitable access to quality educational programs.
The Dashboard’s “3-8” screen provides an overview of New York State Testing Program results. Users can select queries for any combination of BOCES region, school district, school, and assessment type to generate trend and comparison data for student performance in English Language Arts, mathematics, and science.
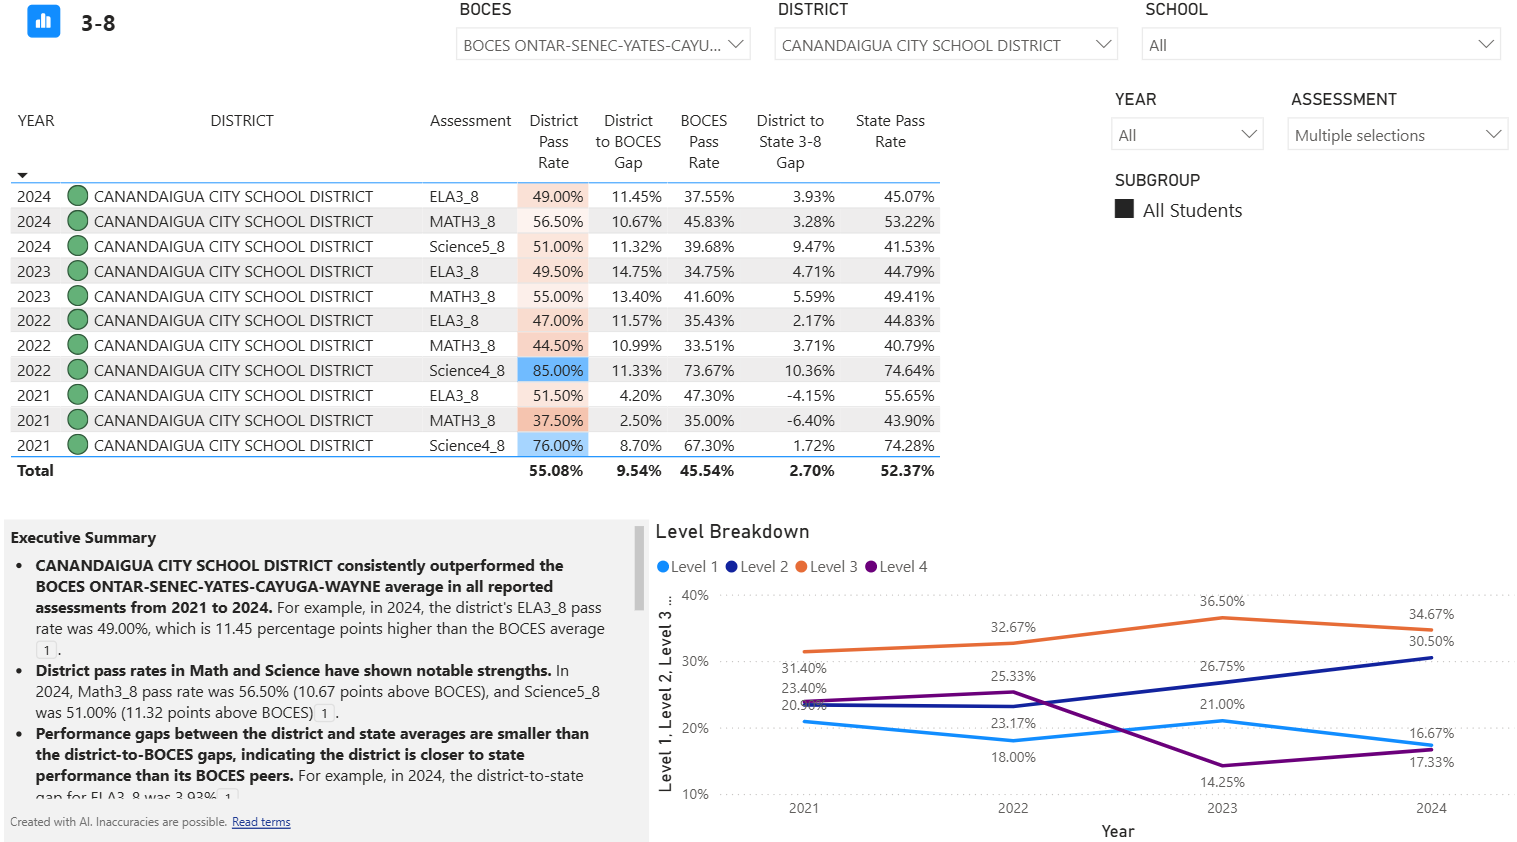
This Dashboard feature allows district leaders to quickly and comprehensively look at student performance throughout the region, fostering conversations among districts about best practices in higher-performing districts that can be replicated in similar-need and similar-resourced lower-performing districts. (Examples of how the Dashboard can facilitate the expanded use of advanced coursework, such as AP and IB, were offered earlier.)
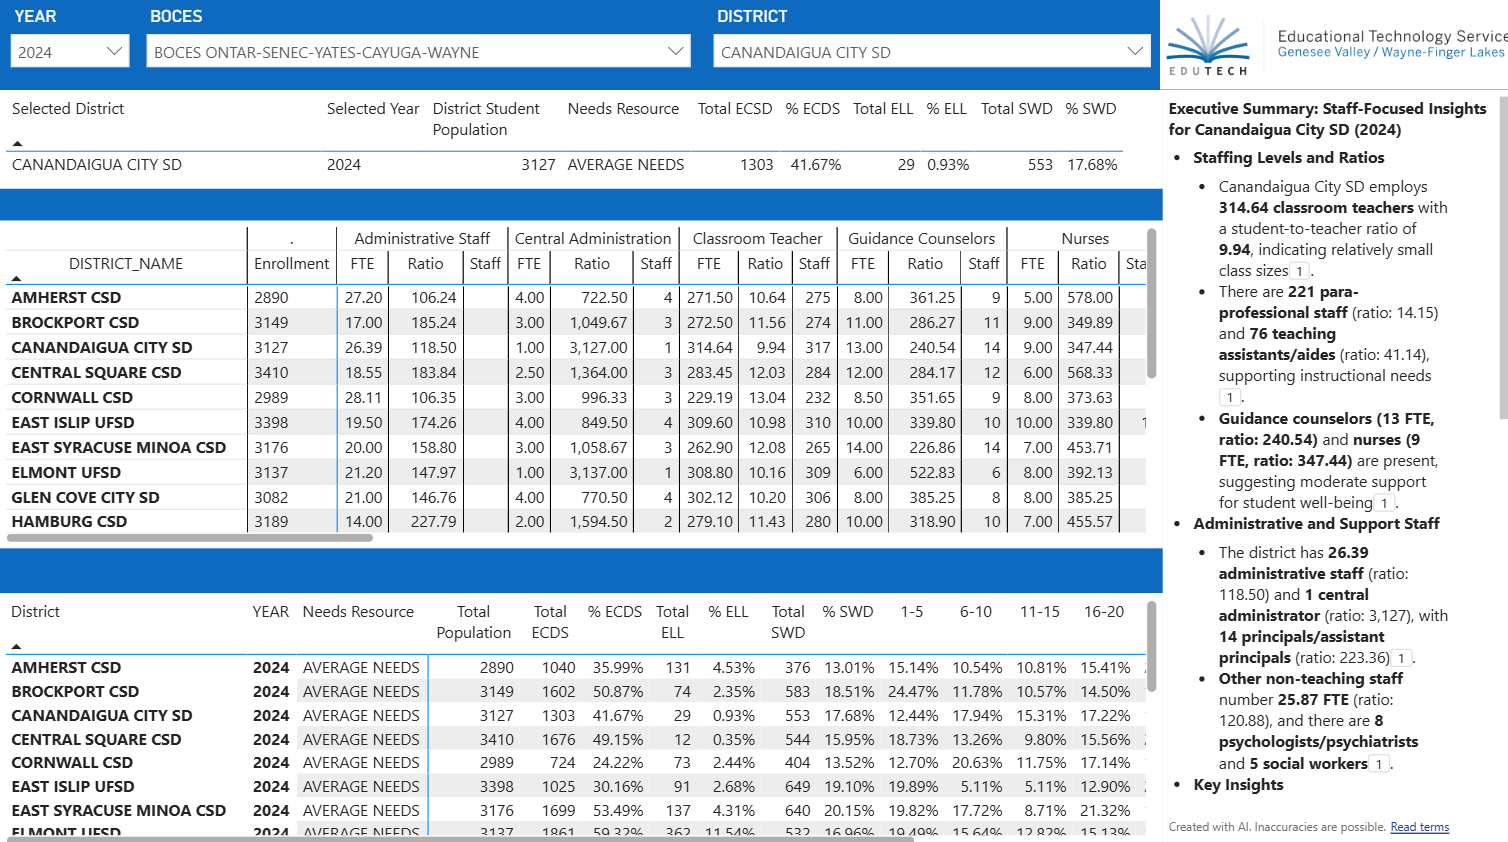
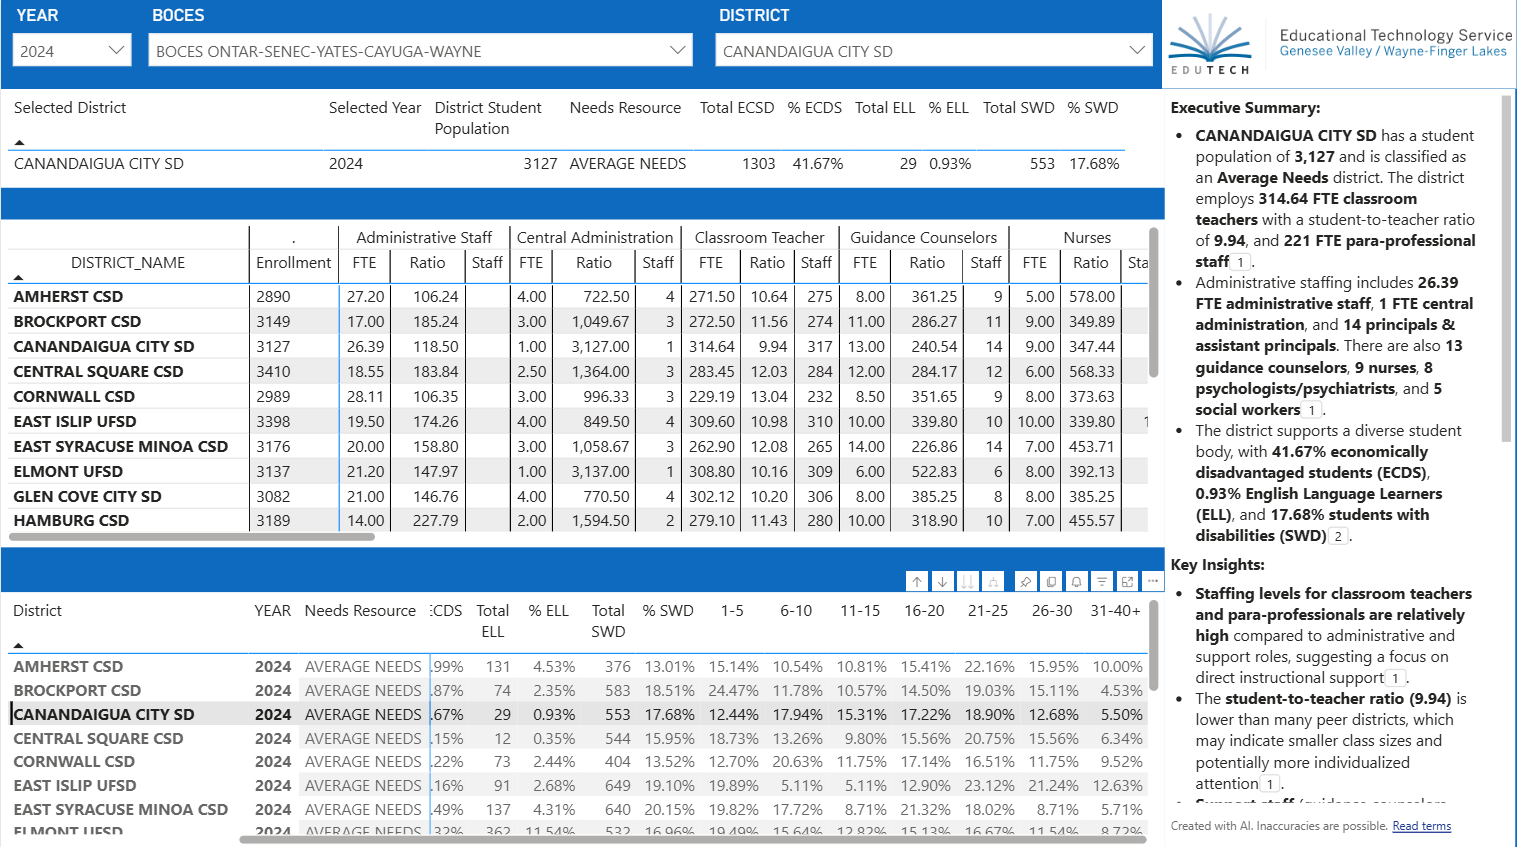
Staffing Needs.
Highlight gaps in staffing and allow alignment with workforce needs.
The Dashboard’s data on staffing includes statistics, including the number of years of employment staff members have, which can help inform staffing decisions if, for example, a district has a high percentage of staff with 26-30 years of experience, and thus nearing retirement. Similarly, if the highest percentage of staff fall into the 1-5 years of experience range, administrative leadership could decide to allocate more resources to professional development.
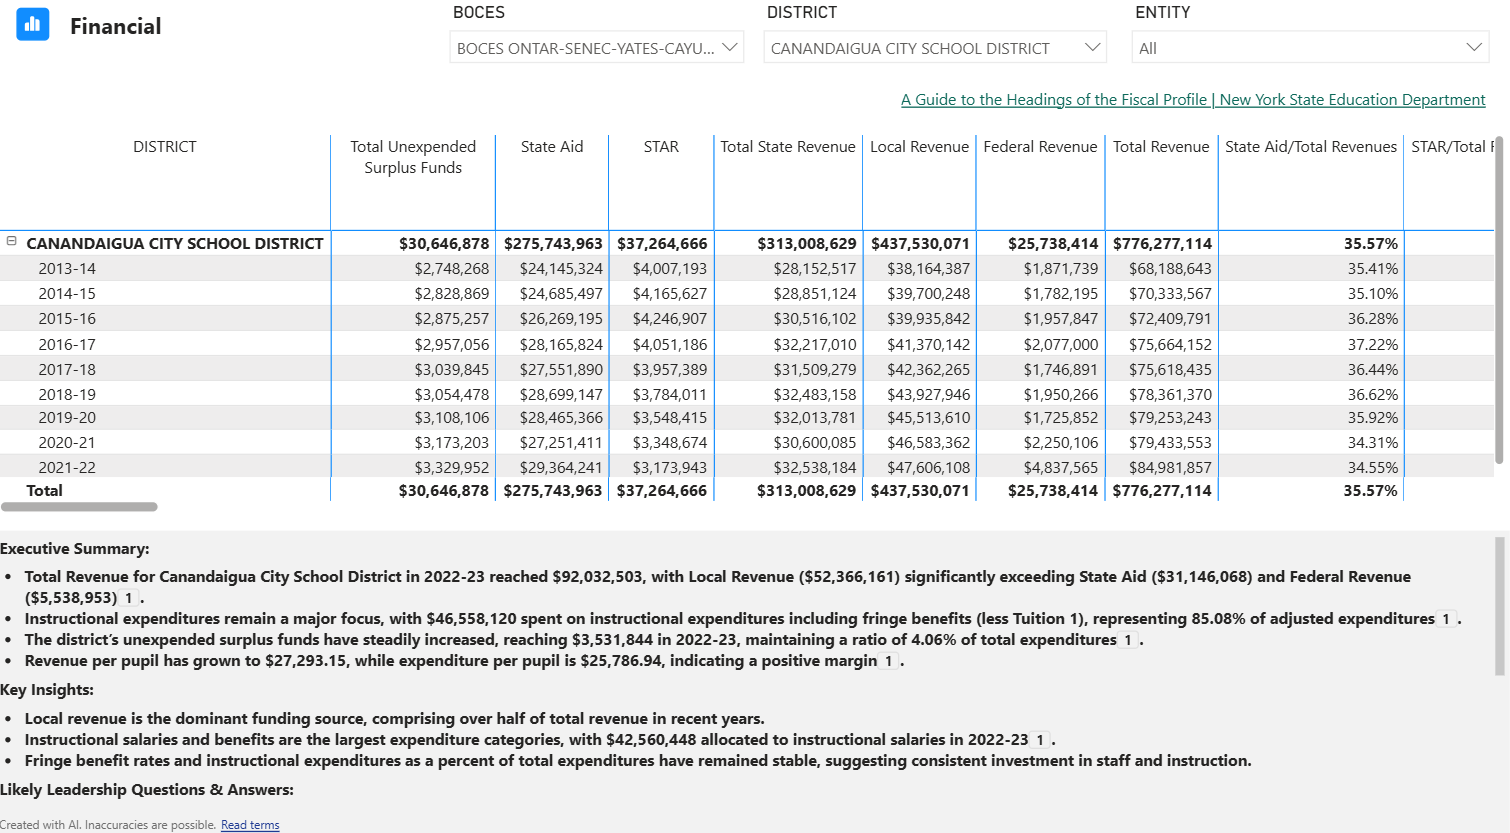
Short- and Long-Term Fiscal Planning.
Identify resource pressures, optimize funding allocations, and plan for sustainability in an uncertain financial environment.
The Dashboard’s “Financial” screen provides the amount of revenue, state aid, expenditures, cost of salaries, and more for each district. This information can be used to help drive conversation regarding financial planning.
The Dashboard’s ability to integrate these focus areas—areas identified by local school district leaders as needing priority action—into one regional view can create a powerful foundation for coordinated action.
The dashboard was built from the ground up with a clear audience in mind:
As one of the co-authors of this piece, Wayne-Finger Lakes BOCES Superintendent Lynne Rutnik wanted to underscore the Dashboard’s value: “I’ve never seen anything like this. This innovation brings real-time data into one shared tool, creating transparency and empowering school district leaders across the entire region to engage in deep, solution-focused conversations. By working collectively, we are fueling innovation, strengthening collaboration, and expanding opportunities for every student in our region.”4
The Regionalization Dashboard equips leaders to:
By shifting from isolated district snapshots to a comprehensive regional perspective, the tool empowers leaders to act not just in the interest of their own districts, but in the interest of the region’s students as a whole.
The tool is already being actively used by district superintendents in both the Wayne-Finger Lakes and Genesee Valley BOCES regions. Stakeholders—including district leaders, building administrators, and data teams—have received training on how to navigate and leverage the dashboard effectively.
Superintendent of the Romulus Central School District, Jennifer Hayden, has used the dashboard to analyze programmatic data in her district. “This tool has allowed us to tell the story of our district in a way we couldn’t before,” she said. “It helps guide real decisions around program offerings, staffing, and funding.” Superintendent Hayden continued:
The user-friendly design of the Dashboard and the training that was provided to us helped our administrative team move beyond relying on feelings and assumptions to instead focus on facts about our district. The nuances we uncovered when we asked the Dashboard deep data-based questions helped highlight both areas where we excel and identified where we need to grow. The information ranged from general finance issues to the very precise academic performance of specific student subgroups. This clear-eyed look at our reality directly shaped the creation of a new strategic plan that is both relevant and responsive, guiding our work for the next five years and sparking ideas for interdistrict collaboration. The dashboard is a very powerful tool, limited only by our creativity in using it.5
Seeing its ongoing potential, school district leaders are asking for the Regionalization Dashboard to be expanded and enhanced, adding information about career and technical education (CTE) classes that are or could be offered regionally, and exploring how the Dashboard can be expanded to include real-time notice of any seats available in various high-quality and unique academic programs offered in one district that could be made available to students across the region, increasing the opportunity for all student to participate in these courses.
The dashboard has been built with scalability in mind. It is designed for broad use by education leaders across New York State. The long-term goal is to make this a statewide BOCES service, allowing all districts in New York to benefit from the same powerful insights and planning tools.
Future enhancements to the Regionalization Dashboard will include the addition of new datasets and more refined analytical tools designed specifically to support policymaking and strategic planning. For example, efforts are being made to break down the data on the Financial screen further to include specific budget item codes, making this section more detailed, more manageable, and more impactful for the user. Bell schedules and transportation schedules are also intended to be included as that data becomes publicly available.
At a time when collaboration among school districts is often no longer a luxury but a necessity, given the stress on financial, operational, and academic programming faced by many smaller and rural districts, this Regionalization Dashboard or efforts like it could serve as a critical foundation for building a stronger, more equitable educational system.
For more information on how to access or implement the Regionalization Dashboard, contact Heather Schuessler, coordinator of instructional data, Genesee Valley/Wayne-Finger Lakes EduTech, at [email protected].
ABOUT THE AUTHORS
Lynne Rutnik is the district superintendent of the Wayne-Finger Lakes BOCES Region. She began her 28-year career in education as a special education teacher, and has served as building principal, academic administrator for special education, director of special education, and as deputy superintendent for Schenectady City School District and superintendent of Lake George Central School District.
Anita Murphy is a retired district superintendent of Capital Region BOCES. She also served as superintendent of schools at Altmar-Parish-Williamstown Central School District, deputy superintendent in both the Rochester City and Syracuse City School Districts, director of instruction in the City School District of Albany, associate commissioner for curriculum, instruction and field services at the New York State Education Department, and a teacher and director of instructional data at the Binghamton City School District.
Brian Backstrom is director of education policy studies at the Rockefeller Institute of Government.
[1] This equates to districts with a total 2013-14 student enrollment of less than 1,042.
[2] Rockefeller Institute analysis of data from the New York State Education Department’s Enrollment Data Archive, https://www.p12.nysed.gov/irs/statistics/enroll-n-staff/ArchiveEnrollmentData.html.
[3] Rockefeller Institute analysis of data from the New York State Education Department’s Enrollment Data Archive, https://www.p12.nysed.gov/irs/statistics/enroll-n-staff/ArchiveEnrollmentData.html.
[4] Conversation with authors, September 2025.
[5] Conversation with authors, September 2025.