
As the Rockefeller Institute of Government’s research has previously outlined, there have been growing public health and policy concerns about per- and polyfluoroalkyl substances (PFAS) over the last decade. PFAS, sometimes colloquially referred to as forever chemicals, are synthetic chemicals that have been widely produced and used in the United States and internationally since the 1940s for their resistance to heat, water, grease, and oil. These properties are due to their strong carbon-fluorine bonds and nonpolar nature (meaning they do not interact strongly with either water or oils). However, they also make PFAS highly persistent in the environment and the human body, contributing to known and potential long-term health impacts. The Organization for Economic Co-operation and Development (OECD) has identified over 4,700 PFAS-related substances, although broader structural definitions suggest that PFAS may encompass far more compounds than this number reflects. Despite this, only a small fraction of these compounds are routinely monitored in drinking water or evaluated for human health effects.
In the United States, drinking water is one of the major pathways of human exposure to PFAS. PFAS exposures are associated with many adverse human health outcomes, including ulcerative colitis, thyroid disease, high cholesterol, pregnancy-induced hypertension, testicular cancer, prostate cancer, and kidney cancer, as well as associations with immunosuppression, vaccine suppression, and reduced infant and fetal growth. Moreover, these drinking water exposures can involve multiple PFAS or co-occurring PFAS compounds. Most regulatory frameworks in the United States, on the other hand, evaluate potential contaminants—including PFAS—individually. However, studies suggest that PFAS may exhibit dose-additive or biologically interacting effects, meaning that when people are exposed to more than one PFAS, the chemicals may combine or interact in ways that increase their overall effects. Consequently, evaluating PFAS compounds individually may result in underestimating the additive and cumulative exposures (repeated exposure over time) that communities may experience when drinking water contamination involves mixtures of PFAS. Recent state policies and federal regulatory proposals have begun to address such mixtures, even as ongoing legal challenges and regulatory shifts may complicate that.
PFAS contamination in drinking water systems frequently occurs as mixtures and not just isolated compounds.
Previous studies have characterized the patterns of PFAS occurrence in drinking water in the US, and related exposures, using data from the US Environmental Protection Agency’s (EPA) Third Unregulated Contaminant Monitoring Rule (the Third UCMR or UCMR3). The UCMR falls under the Safe Drinking Water Act and requires the EPA and certain public water systems to test for unregulated contaminants every five years. The Third UCMR data were collected between 2013 and 2015, and monitored six PFAS compounds (PFOA, PFOS, PFBS, PFHxS, PFHpA, and PFNA). It provided the first nationally representative occurrence data for PFAS in US public water systems, serving as the foundation for numerous studies of PFAS occurrence, co-occurrence, and spatial distribution. The data from the Third UCMR also supported further EPA risk assessments and informed the development of non-enforceable health advisories, while providing critical evidence that many states used in establishing PFAS drinking water standards before the promulgation of the first federal Maximum Contaminant Levels (MCLs) in 2024.
My recent and ongoing research uses data from the EPA’s Fifth Unregulated Contaminant Monitoring Rule (the Fifth UCMR or UCMR5)—the most recent and comprehensive national PFAS monitoring program conducted in drinking water systems to date—to examine PFAS occurrence patterns across more than 10,000 public water systems in the United States. As other scholars have outlined, the testing and reporting requirements for PFAS in the Third UCMR rendered the contamination of systems invisible—but certain changes since then have reflected attempts to address that relative invisibility. The Fifth UCMR data, for example, monitored 29 PFAS compounds as opposed to the six included in the Third UCMR. In addition, the Fifth UCMR included lower reporting levels for certain PFAS compounds from the Third UCMR (meaning more systems, those with lower levels of contamination, would now need to report detections). Additionally, the Fifth UCMR included more drinking water systems—including systems serving over 3,300 people instead of only those serving over 10,000 people as was previously the case—addressing prior observations that many smaller water systems were excluded from testing for unregulated contaminants.
The Fifth UCMR’s complete monitoring data is not yet released; therefore, my current analysis is based on the 95 percent of monitoring data that is currently available to the public. Beyond individual chemicals, I assessed the frequency of each PFAS compound tested for, mixture richness (number of PFAS detected per system), overall contamination burden (or total combined level of PFAS per quantity of water), and recurring mixture patterns. This approach, in combination with the Fifth UCMR’s fuller data set for PFAS, in particular, provides a more holistic understanding of PFAS contamination in drinking water systems, and (as is discussed below) reflects that it frequently occurs as mixtures and not just isolated compounds.
Summary of Analysis and Findings
Across the 10,289 drinking water systems nationwide included in the Fifth UCMR, my analysis reflects that PFAS were detected in 33.9 percent of systems, compared to the roughly 4 percent that had detections in the third UCMR. This contamination was unevenly distributed among those systems with PFAS present. Although the Fifth UCMR monitored 29 different PFAS compounds, only eight were detected in at least 1 percent of public water systems and were therefore retained for the subsequent mixture and frequency analysis discussed here. Those eight compounds are listed in Table 1.
Across the 10,289 drinking water systems nationwide included in the Fifth UCMR… PFAS were detected in 33.9 percent of systems, compared to the roughly 4 percent… in the third UCMR.
Table 1. PFAS Compounds Used In the Statistical Analysis of Frequency and Mixtures
| Abbreviation | Full Name | Chemical Class |
| PFBA | Perfluorobutanoic acid | Short-chain carboxylate (C4) |
| PFPeA | Perfluoropentanoic acid | Short-chain carboxylate (C5) |
| PFHxA | Perfluorohexanoic acid | Short-chain carboxylate (C6) |
| PFHpA | Perfluoroheptanoic acid | Short-chain carboxylate (C7) |
| PFBS | Perfluorobutane sulfonic acid | Short-chain sulfonate (C4) |
| PFHxS | Perfluorohexane sulfonic acid | Long-chain sulfonate (C6) |
| PFOA | Perfluorooctanoic acid | Long-chain carboxylate (C8) |
| PFOS | Perfluorooctane sulfonic acid | Long-chain sulfonate (C8) |
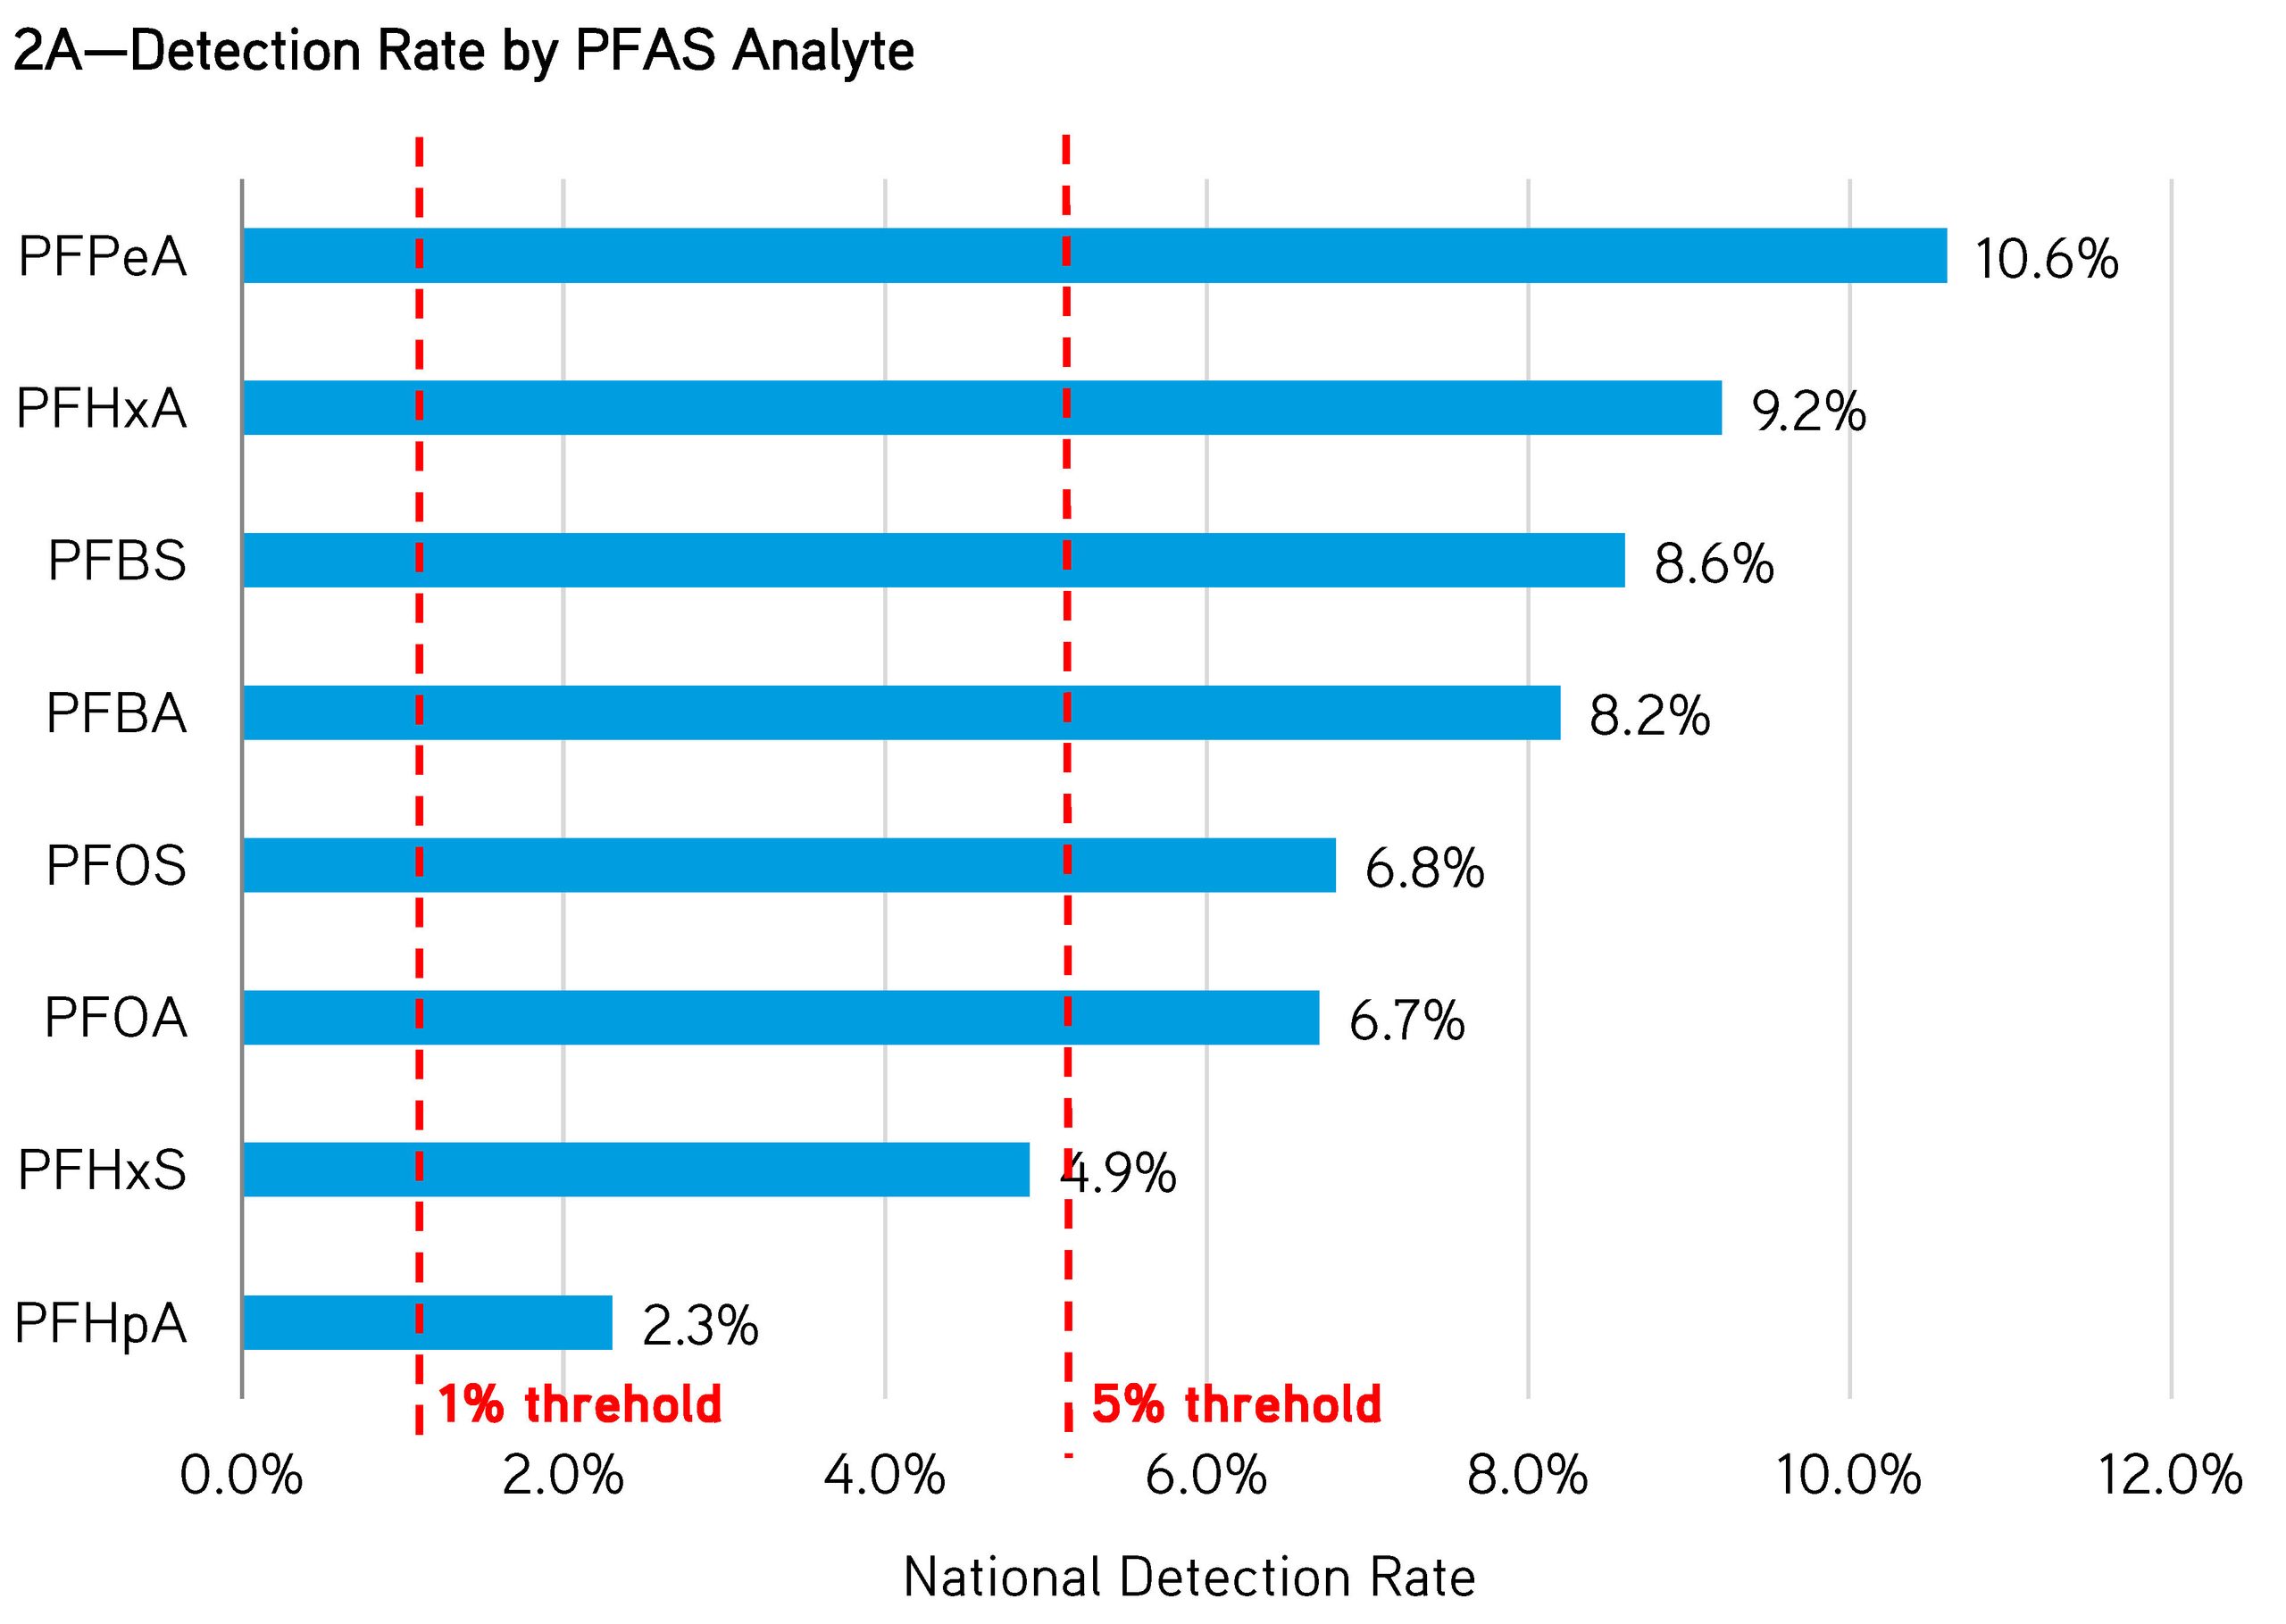
The analysis of data from the Fifth UCMR for the eight PFAS listed in Table 1 shows that short-chain PFAS (containing 4–6 fluorinated carbon atoms and including PFPeA, PFHxA, PFBS, and PFBA) were the most frequently detected in drinking water systems (see Figure 1). These short-chain PFAS compounds have been used as replacement compounds for their longer ‘legacy’ counterparts, because they were initially considered to have lower bioaccumulation potential and shorter biological half-lives. However, short-chain PFAS remain highly persistent, more mobile in aquatic environments, and are increasingly detected in drinking water. At the same time, legacy PFAS (or older, first-generation PFAS which had already begun to be phased out due to environmental and human health concerns), such as PFOS and PFOA, appear to remain widely present, indicating the persistence of historical contamination.
…in the majority of systems with detections, roughly 23.0 percent of all tested water systems and 67.9 percent of those systems detecting any PFAS, more than one PFAS compound was detected…
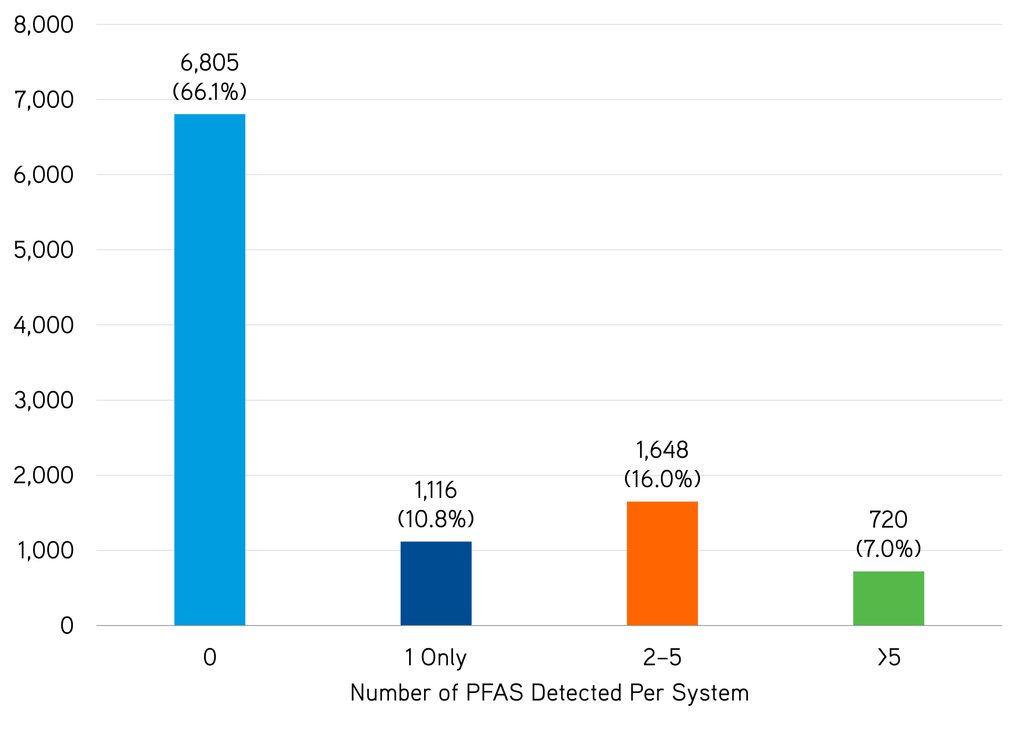
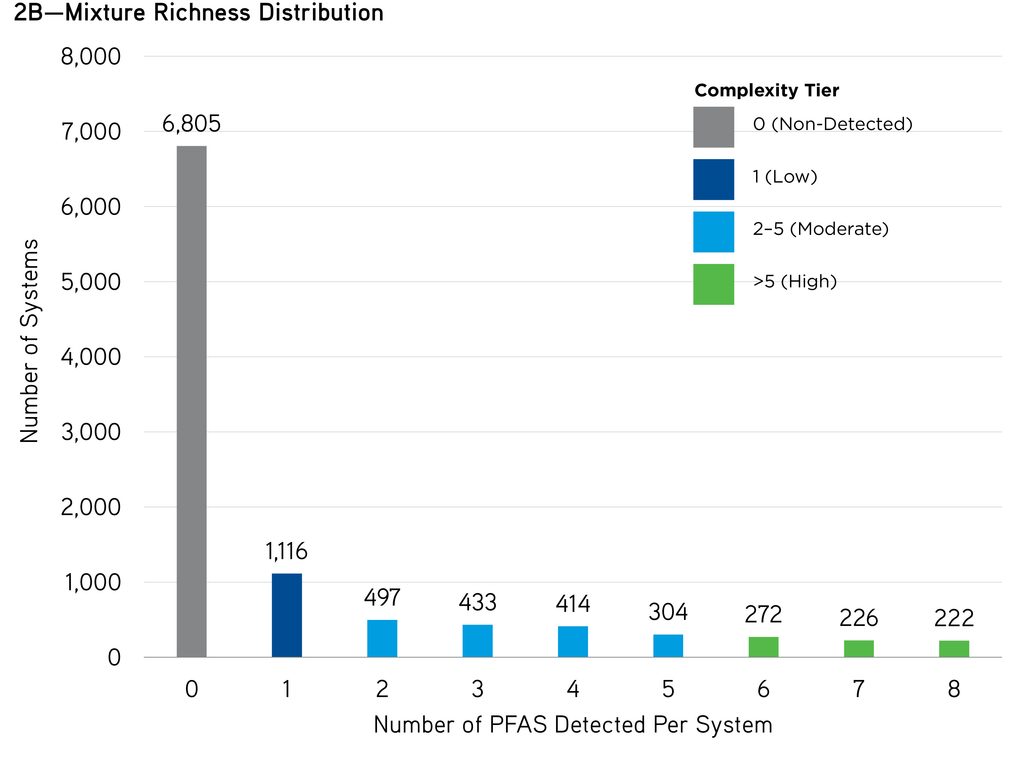
The analysis also reflected the importance of considering mixtures of PFAS. Based on mixture complexity categories of low (1 detected PFAS), moderate (2–5 PFAS detected), and high (>5 detected PFAS), while approximately 10.8 percent of public water systems exhibited low PFAS mixture complexity, 16.0 percent exhibited moderate complexity, and 7.0 percent of public water systems exhibited high PFAS mixture complexity. It is noteworthy that in the majority of systems with detections, roughly 23.0 percent of all tested water systems and 67.9 percent of those systems detecting any PFAS, more than one PFAS compound was detected (see Figure 2).
Figure 2. PFAS Detection Frequencies and Mixture Richness Across US Public Water Systems
Among systems with detectable PFAS (those 33.9 percent of systems tested), total PFAS concentration varied considerably. For example, among the eight PFAS included in the mixture analysis, PFBA had the highest average concentration (13.1 ng/L) and the highest measured concentration (1,700.0 ng/L). But its median concentration was 7.2 ng/L, reflecting that most systems had relatively low PFBA levels. However, the wide range in the level of contamination (from 5.0 to 1,700.0 ng/L) indicates that a small number of systems had much higher concentrations. PFOS also showed relatively high levels in some systems (with an average concentration of 9.9 ng/L and a maximum of 490.0 ng/L). These findings indicate that PFAS occurrence varies not only in detection frequency but also in contamination magnitude and concentration variability across public water systems.
Such differences highlight the need for complementary metrics to better understand the landscape of drinking water contamination for unregulated (and regulated) contaminants—including total PFAS burden (the sum of all PFAS concentrations in a system), mixture richness (the number of different PFAS compounds detected within a system, and mixture profiles (distinct patterns of PFAS composition and co-occurrence among water systems) to comprehensively characterize PFAS occurrence patterns rather than relying on detection frequency alone.
Figure 3. Correlation Among PFAS in Mixtures, Showing Consistent Co-Occurrence Patterns
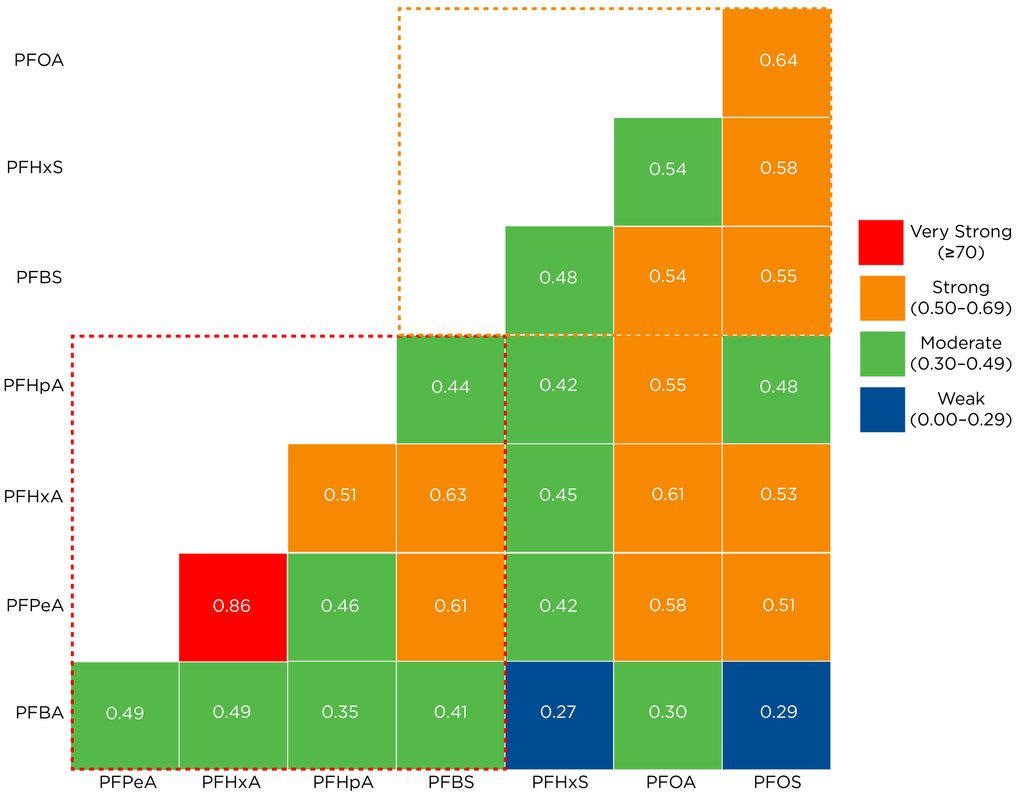
Note: Spearman’s correlation coefficient (ρ), the numerical values presented in this figure, range from −1 to 1. Larger positive values indicate that two PFAS are more consistently detected together across public water systems. Correlations were interpreted as weak (0.00–0.29), moderate (0.30–0.49), strong (0.50–0.69), and very strong (≥0.70).
Of the PFAS detected in mixtures, certain compounds were more frequently detected together, indicating they may come from similar sources or move through the environment in similar ways.
There were recurring patterns of mixtures across public water systems included in the Fifth UCMR (Figure 4).
The correlation analysis of mixtures showed that several PFAS consistently occurred together across US public water systems. For example, the very strong correlation between certain short-chain PFAS—PFPeA and PFHxA (ρ = 0.86)—suggests that these compounds frequently co-occur and may share common chemistries, sources, or environmental transport pathways. Similarly, the strong correlation between the legacy long-chain PFAS—PFOA and PFOS (ρ = 0.64)—indicates recurring co-occurrence patterns. These findings indicate that PFAS contamination is what environmental health scientists call structured (or patterned) rather than random, with predictable combinations of compounds, often shaped by common sources, environmental transport processes, and chemical characteristics such as persistence.
The analysis also, however, reflects that a smaller subset of systems had more complex mixtures. These mixtures may have been influenced by multiple contamination sources over time and reflect not only those source characteristics, but chemical behavior and environmental fate processes, resulting in recognizable patterns of exposure across drinking water systems.
More broadly, these recurring patterns and the frequency with which mixtures of PFAS occur across drinking water systems in the US highlight the need to evaluate these contaminants as mixtures when considering potential exposures, their impacts, and treatment options for systems and individuals. Treatment options or interventions focused on a single target compound may not adequately mitigate overall PFAS burden or address mixture-related health risks.
Policy Implications
Prior to the finalization of federal drinking water standards in 2024, several states—including California, Massachusetts, Michigan, Minnesota, New Hampshire, New Jersey, New York, North Carolina, Vermont, and Washington—had already established enforceable drinking water standards for selected PFAS. These state-level regulations reflected growing concerns about PFAS contamination as well as a variable regulatory landscape—with respect to which compounds were regulated and at what levels (or concentrations) they were regulated. In addition, some of these states had established regulatory standards related to mixtures—by setting combined standards. For example, in 2020, Massachusetts established a maximum contaminant level for the combined total levels of six PFAS (PFOS, PFOA, PFHxS, PFNA, PFHpA, and PFDA) of 20 ng/L or parts per trillion (ppt). New York State does not currently have a combined standard, though it established individual standards for PFOA and PFOS (of 10 ppt each) in 2020.
The 2024 federal regulations for PFAS in drinking water established under the Biden administration similarly (though not in exactly the same manner) included not only individual standards for five PFAS (PFOA, PFOS, PFNA, PFHxS, and HFPO-DA or GenX) but also established a combined hazard index for four PFAS (PFHxS, PFNA, HFPO-DA, and PFBS). A hazard index is calculated by adding the ratio of the sample’s concentration to an established health-based concentration across included compounds. The sum of those ratios for included compounds in this case had to be less than or equal to one. As the Environmental Protection Agency (EPA) then noted with respect to the standard: “the Hazard Index is a long-established approach that the EPA regularly uses, for example in the Superfund program, to determine the health concerns associated with exposure to chemical mixtures.”
In 2026, under the Trump administration, the EPA then proposed changes to the 2024 regulations (which have not yet been implemented according to the compliance timeline). While the EPA’s proposal would keep the individual standards for PFOA and PFOS, it would extend the timeline for compliance for water systems and—critical to the discussion of mixtures—start a regulatory process to roll back the hazard index.1 In response to these actions, some states have considered adopting the 2024 federal standards in state law or regulations. The New York State Legislature, for example, passed a bill in May 2026 that would require the State Department of Health adopt the 2024 federal individual standards for PFOA, PFOS, PFNA, PFHXS, and HFPO-DA (or GenX), though it would not require the adoption of the hazard index. As with other passed legislation, the governor will have until the end of the year to decide whether or not to sign and enact the bill.
Conclusion
Using nationally representative data from the Fifth UCMR, the underlying research discussed here reflects that PFAS contamination of drinking water is not only widespread, occurring in over 33 percent of tested systems, but often (if not always) occurs as a mixture. Roughly 23 percent of all systems analyzed, and 68 percent of those systems analyzed that detected any PFAS, detected mixtures of more than one PFAS.
This research also reflects that these mixtures vary in complexity and level of overall contamination across public water systems. In other words, PFAS contamination in US drinking water is patterned in ways that many existing regulatory frameworks aren’t typically structured to address. Recent testing in New York State has further reflected that small drinking water systems—those serving up to 3,300—represent the far majority of exceedances for PFOA and PFOS (for both the existing state standard of 10 ppt each and the federal standard finalized in 2024 of 4 ppt each). Because these small systems fall outside UCMR testing (with the exception of a small sample), the above results related to mixtures do not reflect them. This emphasizes the need for broader monitoring efforts with respect to small systems to more fully understand the distribution of PFAS mixtures across not only New York State but across US drinking water systems.
As national and state efforts towards monitoring PFAS continue to evolve, policy approaches could, therefore, better address how PFAS contamination occurs in the real world. Individual standards alone do not appear to fully address the ways in which people are often exposed to PFAS. The findings here highlight the value of complementing existing regulatory frameworks with mixture-based testing, research, and related regulatory standards that better reflect actual exposure conditions. Incorporating information on PFAS occurrence patterns in regulatory processes that include attention to cumulative burdens and system-level mixture profiles could help prioritize monitoring, guide infrastructure investments, identify communities facing disproportionate contamination, and support more effective and equitable drinking water policies.
ABOUT THE AUTHOR(S)
Francis Ofori-Awuku is a graduate research assistant at the Rockefeller Institute of Government.- Rule, S. W. T. (2003), Environmental Protection Agency 40 CFR Parts 141 and 142. ↩︎